The documentation you are viewing is for Dapr v1.12 which is an older version of Dapr. For up-to-date documentation, see the latest version.
Using OpenTelemetry Collector to collect traces to send to Jaeger
While Dapr supports writing traces using OpenTelemetry (OTLP) and Zipkin protocols, Zipkin support for Jaeger has been deprecated in favor of OTLP. Although Jaeger supports OTLP directly, the recommended approach for production is to use the OpenTelemetry Collector to collect traces from Dapr and send them to Jaeger, allowing your application to quickly offload data and take advantage of features like retries, batching, and encryption. For more information, read the Open Telemetry Collector documentation.
Configure Jaeger in self-hosted mode
Local setup
The simplest way to start Jaeger is to run the pre-built, all-in-one Jaeger image published to DockerHub and expose the OTLP port:
docker run -d --name jaeger \
  -p 4317:4317  \
  -p 16686:16686 \
  jaegertracing/all-in-one:1.49
Next, create the following config.yaml file locally:
Note: Because you are using the Open Telemetry protocol to talk to Jaeger, you need to fill out the
otelsection of the tracing configuration and set theendpointAddressto the address of the Jaeger container.
apiVersion: dapr.io/v1alpha1
kind: Configuration
metadata:
  name: tracing
  namespace: default
spec:
  tracing:
    samplingRate: "1"
    stdout: true
    otel:
      endpointAddress: "localhost:4317"
      isSecure: false
      protocol: grpc
To launch the application referring to the new YAML configuration file, use
the --config option. For example:
dapr run --app-id myapp --app-port 3000 node app.js --config config.yaml
View traces
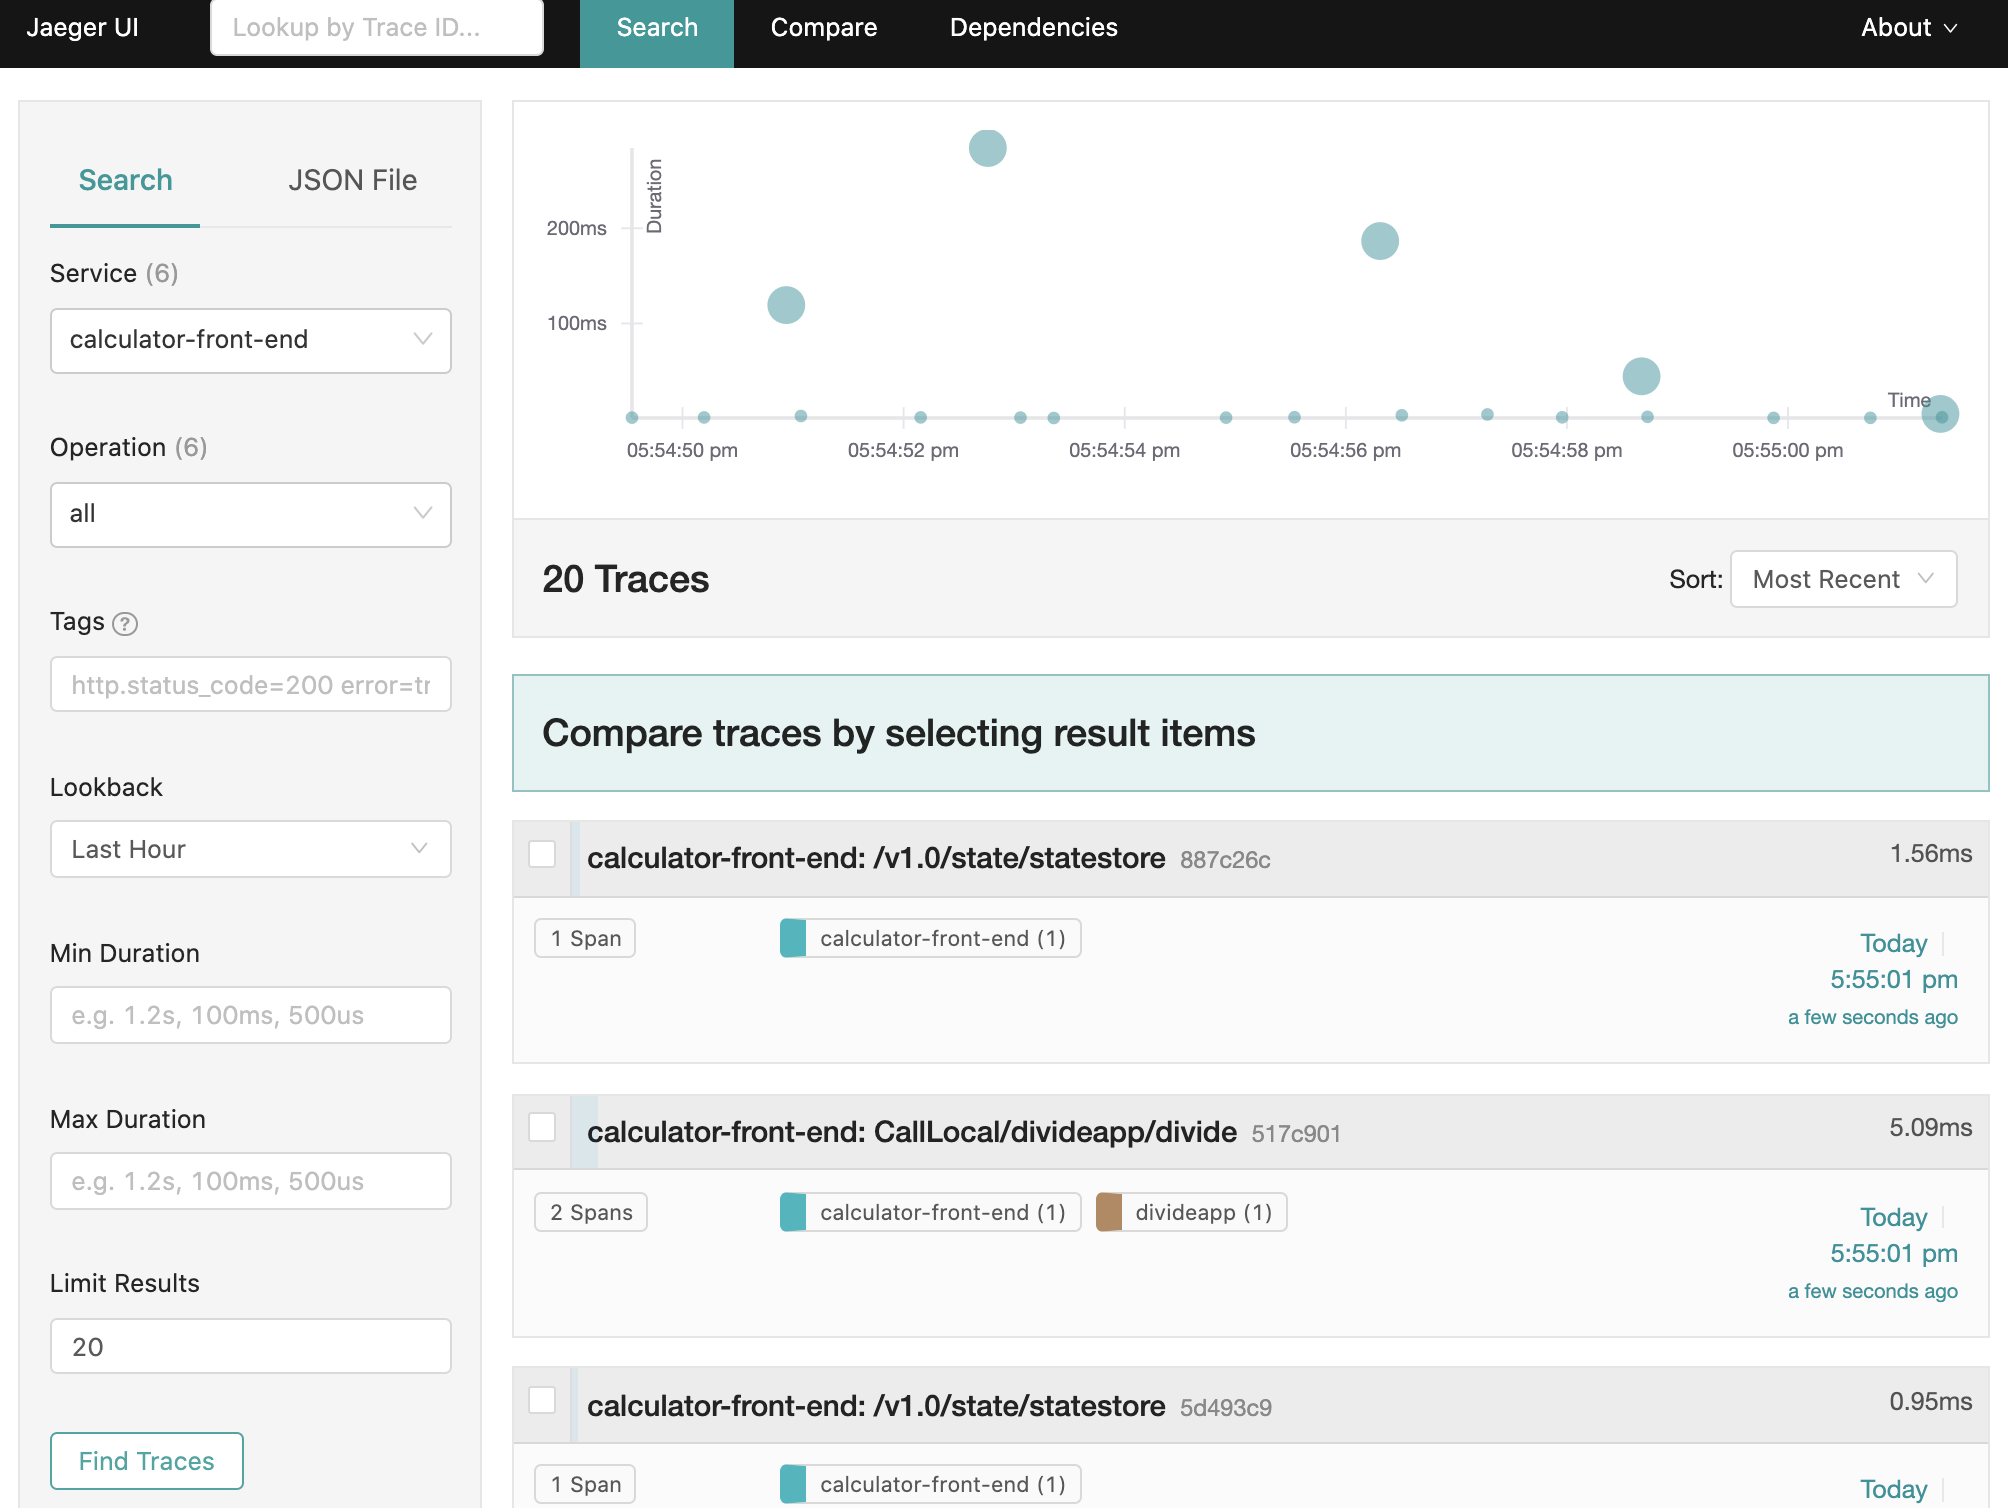
To view traces in your browser, go to http://localhost:16686 to see the Jaeger UI.
Configure Jaeger on Kubernetes with the OpenTelemetry Collector
The following steps show you how to configure Dapr to send distributed tracing data to the OpenTelemetry Collector which, in turn, sends the traces to Jaeger.
Prerequisites
- Install Dapr on Kubernetes
- Set up Jaeger using the Jaeger Kubernetes Operator
Set up OpenTelemetry Collector to push to Jaeger
To push traces to your Jaeger instance, install the OpenTelemetry Collector on your Kubernetes cluster.
-
Download and inspect the
open-telemetry-collector-jaeger.yamlfile. -
In the data section of the
otel-collector-confConfigMap, update theotlp/jaeger.endpointvalue to reflect the endpoint of your Jaeger collector Kubernetes service object. -
Deploy the OpenTelemetry Collector into the same namespace where your Dapr-enabled applications are running:
kubectl apply -f open-telemetry-collector-jaeger.yaml
Set up Dapr to send traces to OpenTelemetryCollector
Create a Dapr configuration file to enable tracing and export the sidecar traces to the OpenTelemetry Collector.
-
Use the
collector-config-otel.yamlfile to create your own Dapr configuration. -
Update the
namespaceandotel.endpointAddressvalues to align with the namespace where your Dapr-enabled applications and OpenTelemetry Collector are deployed. -
Apply the configuration with:
kubectl apply -f collector-config.yaml
Deploy your app with tracing enabled
Apply the tracing Dapr configuration by adding a dapr.io/config annotation to the application deployment that you want to enable distributed tracing for, as shown in the following example:
apiVersion: apps/v1
kind: Deployment
metadata:
  ...
spec:
  ...
  template:
    metadata:
      ...
      annotations:
        dapr.io/enabled: "true"
        dapr.io/app-id: "MyApp"
        dapr.io/app-port: "8080"
        dapr.io/config: "tracing"
You can register multiple tracing exporters at the same time, and the tracing logs are forwarded to all registered exporters.
That’s it! There’s no need to include the OpenTelemetry SDK or instrument your application code. Dapr automatically handles the distributed tracing for you.
View traces
To view Dapr sidecar traces, port-forward the Jaeger Service and open the UI:
kubectl port-forward svc/jaeger-query 16686 -n observability
In your browser, go to http://localhost:16686 and you will see the Jaeger UI.

References
Feedback
Was this page helpful?
Glad to hear it! Please tell us how we can improve.
Sorry to hear that. Please tell us how we can improve.